Updated: Monday, Dec 15 01:22:48 AM EST
Troy Trojans vs UAB Blazers (Final)
86 - 85, (Margin: +1, Total: 171)
Bartow Arena
Second-Half conditional estimates based on a margin of -4.0 points and 74.0 total points (models are continuously adjusted up to Halftime)
------------------------------------------------------------------------------------------------------------------------------------------------------
E[AWAY] E[HOME] E[SP] 68% CI E[TOTAL] 68% CI 2H-A 2H-H 2H-SP 2H-TTL AWAY WIN% HOME WIN% (ODDS HOME)
======================================================================================================================================================
77.4 79.3 -2.0 (-12.0, +8.1) 156.7 (144.5, 168.9) 0.0 0.0 -2.0 156.7 47.1% 52.9% -112
------------------------------------------------------------------------------------------------------------------------------------------------------
Live conditional estimates per 5 Minutes (+/- 1 deviation) (models are continuously adjusted)
------------------------------------------------------------------------------------------------------------------------------------------------------
TYPE 5M 10M 15M 20M 25M 30M 35M 40M
======================================================================================================================================================
E[SP] - - - - - - - -1.6
P[W] - - - - - - - 77.4%
ODDS - - - - - - - -342
------------------------------------------------------------------------------------------------------------------------------------------------------
Ornstein-Uhlenbeck Process with BIC Model Selection**
TYPE L95% E[X] U95%
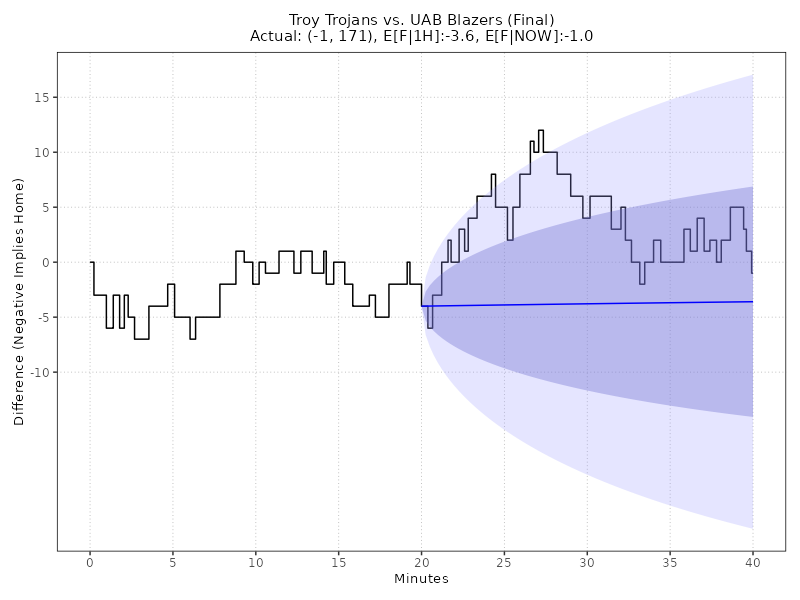
E[F|1H] -24.2 -3.6 17.1
E[F|NOW] -1.0 -1.0 -1.0
Deep Learning: Quantile GRU v6.0 (Neural Network with Calibrated Uncertainty)
TYPE L95% L68% E[X] U68% U95%
E[F|1H] -5.0 -4.2 -4.0 -3.7 -3.1
E[F|NOW] -1.7 -1.3 -1.1 -0.9 -0.5
Enhanced Ornstein-Uhlenbeck Process (BIC-optimized AR order, continuous-time Kalman filtering)
 MODEL NOTES:
** O-U Process validated on 61,166 games (MAE: 8.50 pts, well-calibrated 68%/95% confidence intervals)
** GRU v6.0 validated on Fall 2025 (MAE: 10.99 pts, 5.2% better than previous LSTM)
CHART LEGEND:
1) Blue line: O-U Improved model trained on first-half data, locked at halftime (68% and 95% CI shown)
2) Green line: O-U Improved model continuously retrained as new plays arrive (68% CI shown)
3) Both lines use the same statistical model; divergence shows how live events update predictions
4) Model automatically selects AR(1) or AR(2) using BIC for optimal fit to irregular scoring events
Updated: Monday, Dec 15 01:22:48 AM EST
Back
MODEL NOTES:
** O-U Process validated on 61,166 games (MAE: 8.50 pts, well-calibrated 68%/95% confidence intervals)
** GRU v6.0 validated on Fall 2025 (MAE: 10.99 pts, 5.2% better than previous LSTM)
CHART LEGEND:
1) Blue line: O-U Improved model trained on first-half data, locked at halftime (68% and 95% CI shown)
2) Green line: O-U Improved model continuously retrained as new plays arrive (68% CI shown)
3) Both lines use the same statistical model; divergence shows how live events update predictions
4) Model automatically selects AR(1) or AR(2) using BIC for optimal fit to irregular scoring events
Updated: Monday, Dec 15 01:22:48 AM EST
Back