Updated: Monday, Apr 08 11:30:34 PM EST

TXTEC vs VA (0:01 - 2nd Half)
68 - 68, (Margin: +0, Total: 136)
U.S. Bank Stadium, Minneapolis, MN


Second-Half conditional estimates based on a margin of -3.0 points and 61.0 total points (models are continously adjusted up to Halftime)
===================================================================================================================================================
E[AWAY]	E[HOME]	E[SP]	    68% CI	  E[TOTAL]	    68% CI	 2H-A	 2H-H	2H-SP	2H-TTL	AWAY WIN%	HOME WIN%	(ODDS HOME)
--------------------------------------------------------------------------------------------------------------------------------------------------
63.0	69.0	-6.0	(-15.5, +4.0)	    132.0	(120.0, 144.5)	34.0	37.0	-3.0	71.0	   31.0%	   69.0%	-226
===================================================================================================================================================

Live conditional estimates per 5 Minutes (+/- 1 deviation) (models are continously adjusted)
===================================================================================================================================================
  TYPE        5M	       10M	       15M	       20M	       25M	       30M	       35M	       40M
--------------------------------------------------------------------------------------------------------------------------------------------------
E[SP]	---  ( ---)	---  ( ---)	---  ( ---)	---  ( ---)	---  ( ---)	---  ( ---)	---  ( ---)	3    (   0)
P[W]	---%   ---%	---%   ---%	---%   ---%	---%   ---%	---%   ---%	---%   ---%	---%   ---%	100%     0%
ODDS	---       	---       	---       	---       	---       	---       	---       	604088011785656
===================================================================================================================================================

Continuous AR(1) via Kalman Filter**
TYPE		L95%	E[X]	U95%
E[F|1H]  	-6.0	-2.0	1.5
E[F|NOW]	-6.5	-2.0	1.5

Live Endogenous Model (Parameterized Orstein-Uhlenbeck Process, stationary)


** Accounts for uneven sampling of scoring events
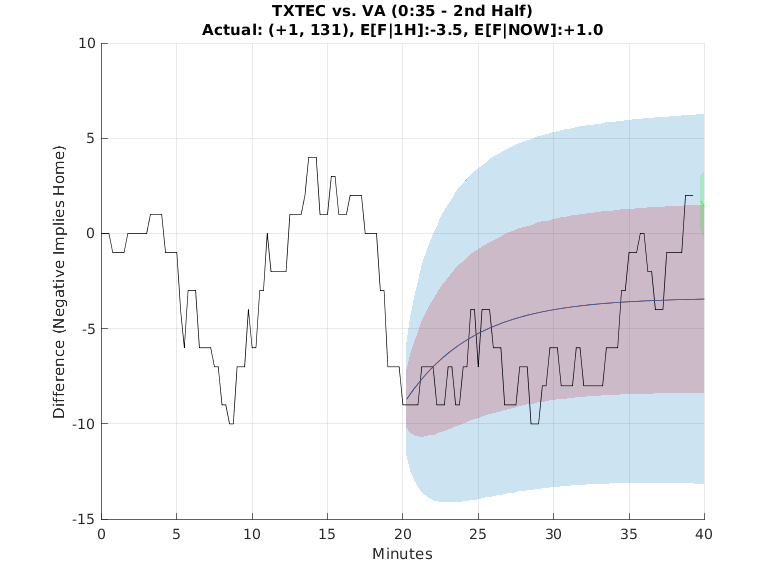
1) Blue line with 68% and 95% confidence interval is live estimate of half-time spread (can vary with exogenous 2ND half model above)
2) Green line with 68% confidence interval is live estimate of spread (can vary with exogenous live model above)
3) The blue and green lines are useful to track in-game divergence during second-half play

Updated: Monday, Apr 08 11:30:34 PM EST
Back